
I was recently invited to give a talk to a group of research students at my university currently applying for funding from the Government of Ireland Postdoctoral Fellowship Programme. Specifically, my topic was to be on Gantt charts since the programme application guidelines indicated that while not compulsory, applicants could certainly include one. From my perspective, why not use a Gantt chart for the entire PhD research project, just like I did?
Gantt charts did not feature in my learning portfolio of blog posts on pathwaytophd. Why was this? Well, as a seasoned project manager I was very familiar with Gantt charts as a concept and with a variety of software tools to support their use. For my audience however, I could appreciate their perspective since they may never have come across a Gantt chart. Further, proactive students attempting to find out more by using Microsoft Copilot (our university-licenced Generative AI tool) may have been even more confused since the response to my prompt (how do I create a Gantt chart?) was not particularly helpful! So, I created a slide set to guide my talk and include my notes below for a wider audience to openly access if interested.
So, first things first, what exactly is a Gantt Chart? Simply, it is a visual representation of a project timeline. It can be as detailed as you wish it to be, showing research activities that may be done in a month, a week or a day, the level of detail is entirely up to you.
My PhD was structured, with two years of module work and another minimum of two years to produce a 50,000 word thesis, so my Gantt chart would focus on the latter two-year timeframe. I was self-funded so time was money and I didn’t want to have to pay more in fees than was necessary! Even though I was familiar with using a variety of tools to manage projects, sometimes the time expended to learn and maintain these is a pain. With my PhD project I didn’t have time to waste and since we were provided with an initial Excel template it made sense to leverage it.

This image is from my initial outline created in December 2020 as I was thinking about the years ahead. I couldn’t fit the whole year on the one slide visibly but you get the idea! Based on what you know regarding your PhD at this point, fill in some blanks, project deliverables and key milestones. So, at a high level, what is to be done and when is it to be done by.
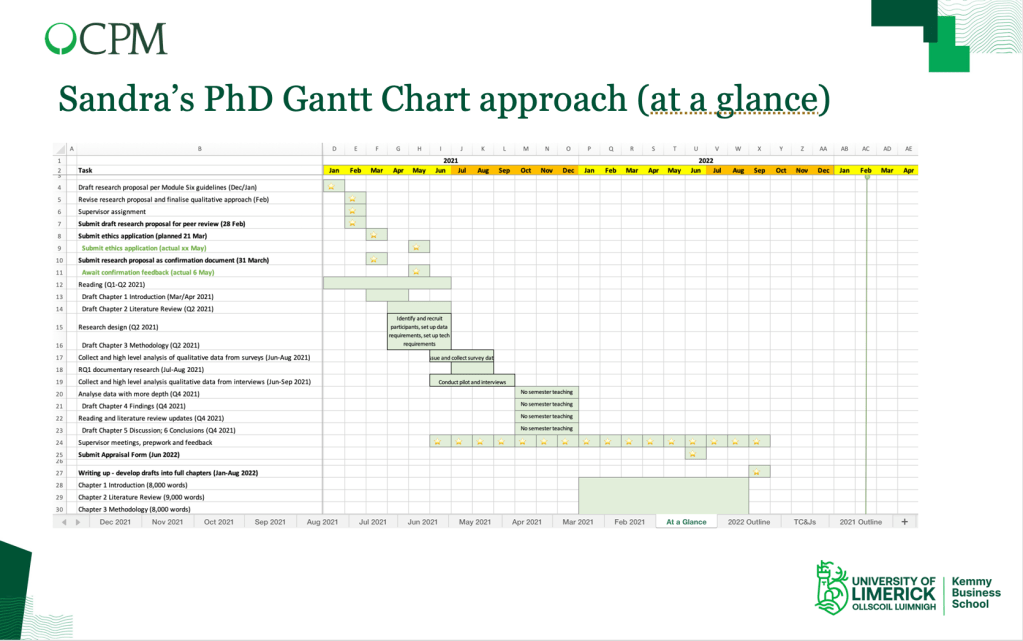
This is my ‘At a Glance’ worksheet, a bird’s eye view of the two years ahead on a single sheet. Of course, lots would change in that time but for now this was a good high level plan with more detail to follow. So, to all intents and purposes this is a visual representation of the project but excludes the detailed level required.

Now, this is a sheet labelled May 2021 as I was planning my data collection. I listed the activities to the level of detail I wanted (column B). I added in dates in columns C and D and then set Column E with some basic conditional formatting. ‘Not started’ would auto colour to pink, ‘In progress’ to orange and ‘Complete’ to green, so nothing fancy. I colour coded the days manually in the cell of the day concerned when I was working on an activity and added a star for a key milestone (it’s the little things!).
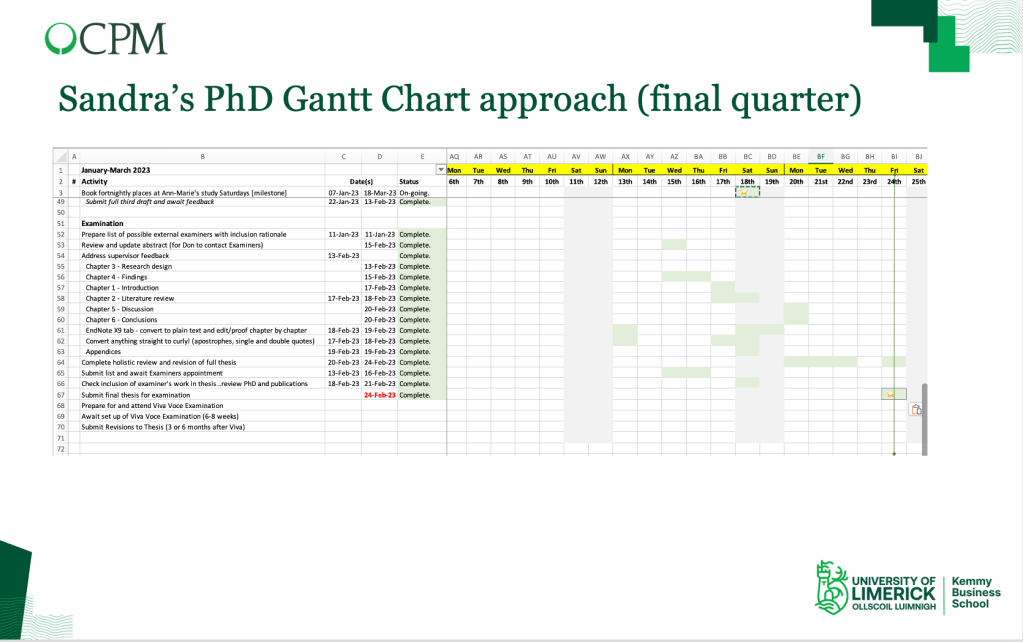
As my submission date loomed it was nice to see fewer activities in this sheet, all green in colour, marked as complete. Throughout, I was not a fan of anything coloured red, hence pink for ‘not started’ or ‘overdue’. One exception was when I needed to push out my final submission date by two months owing to a fractured wrist, hence the red font!
My recommendation is that your PhD research should be treated as a project to help you keep on track, noting that adjustments may be required. It may help to using project terminology. Activities are the actions you take to achieve deliverables so for example all the reading that you undertake (activities) will at some point become a literature review draft (deliverable) by a date agreed with your supervisor (milestone).
So, this has been a whistlestop tour of using a Gantt chart to manage your PhD research project. While many tools may be used, a simple Excel file with some basic conditional formatting should suffice and will minimise additional effort learning tools that may or may not do the same job!
Wishing you all the best with your project!
Until next time, Sandra
Featured image courtesy of inspireus from Pixabay
